
Smart reporting in Business Central: insights for every organization
Do you want to do more with your data? Then reporting is in Business Central the key to success. In this guide, you'll discover how to get the most out of your grades as an employee, manager or board member — using standard reports, analysis modes and Power BI dashboards.
Standard reports in Business Central: fast and familiar
For operational users, standard reports in Business Central often the starting point. Think of sales invoices, order confirmations and purchase overviews.
Examples of standard reports:
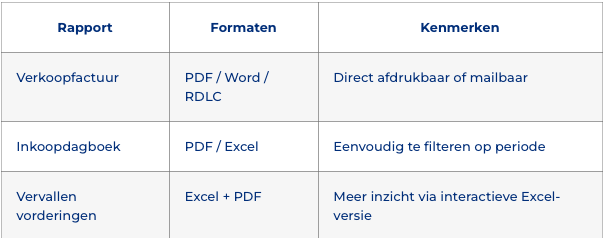
Tip: Use “All reports” in the search field to get a complete overview of what your user role allows.
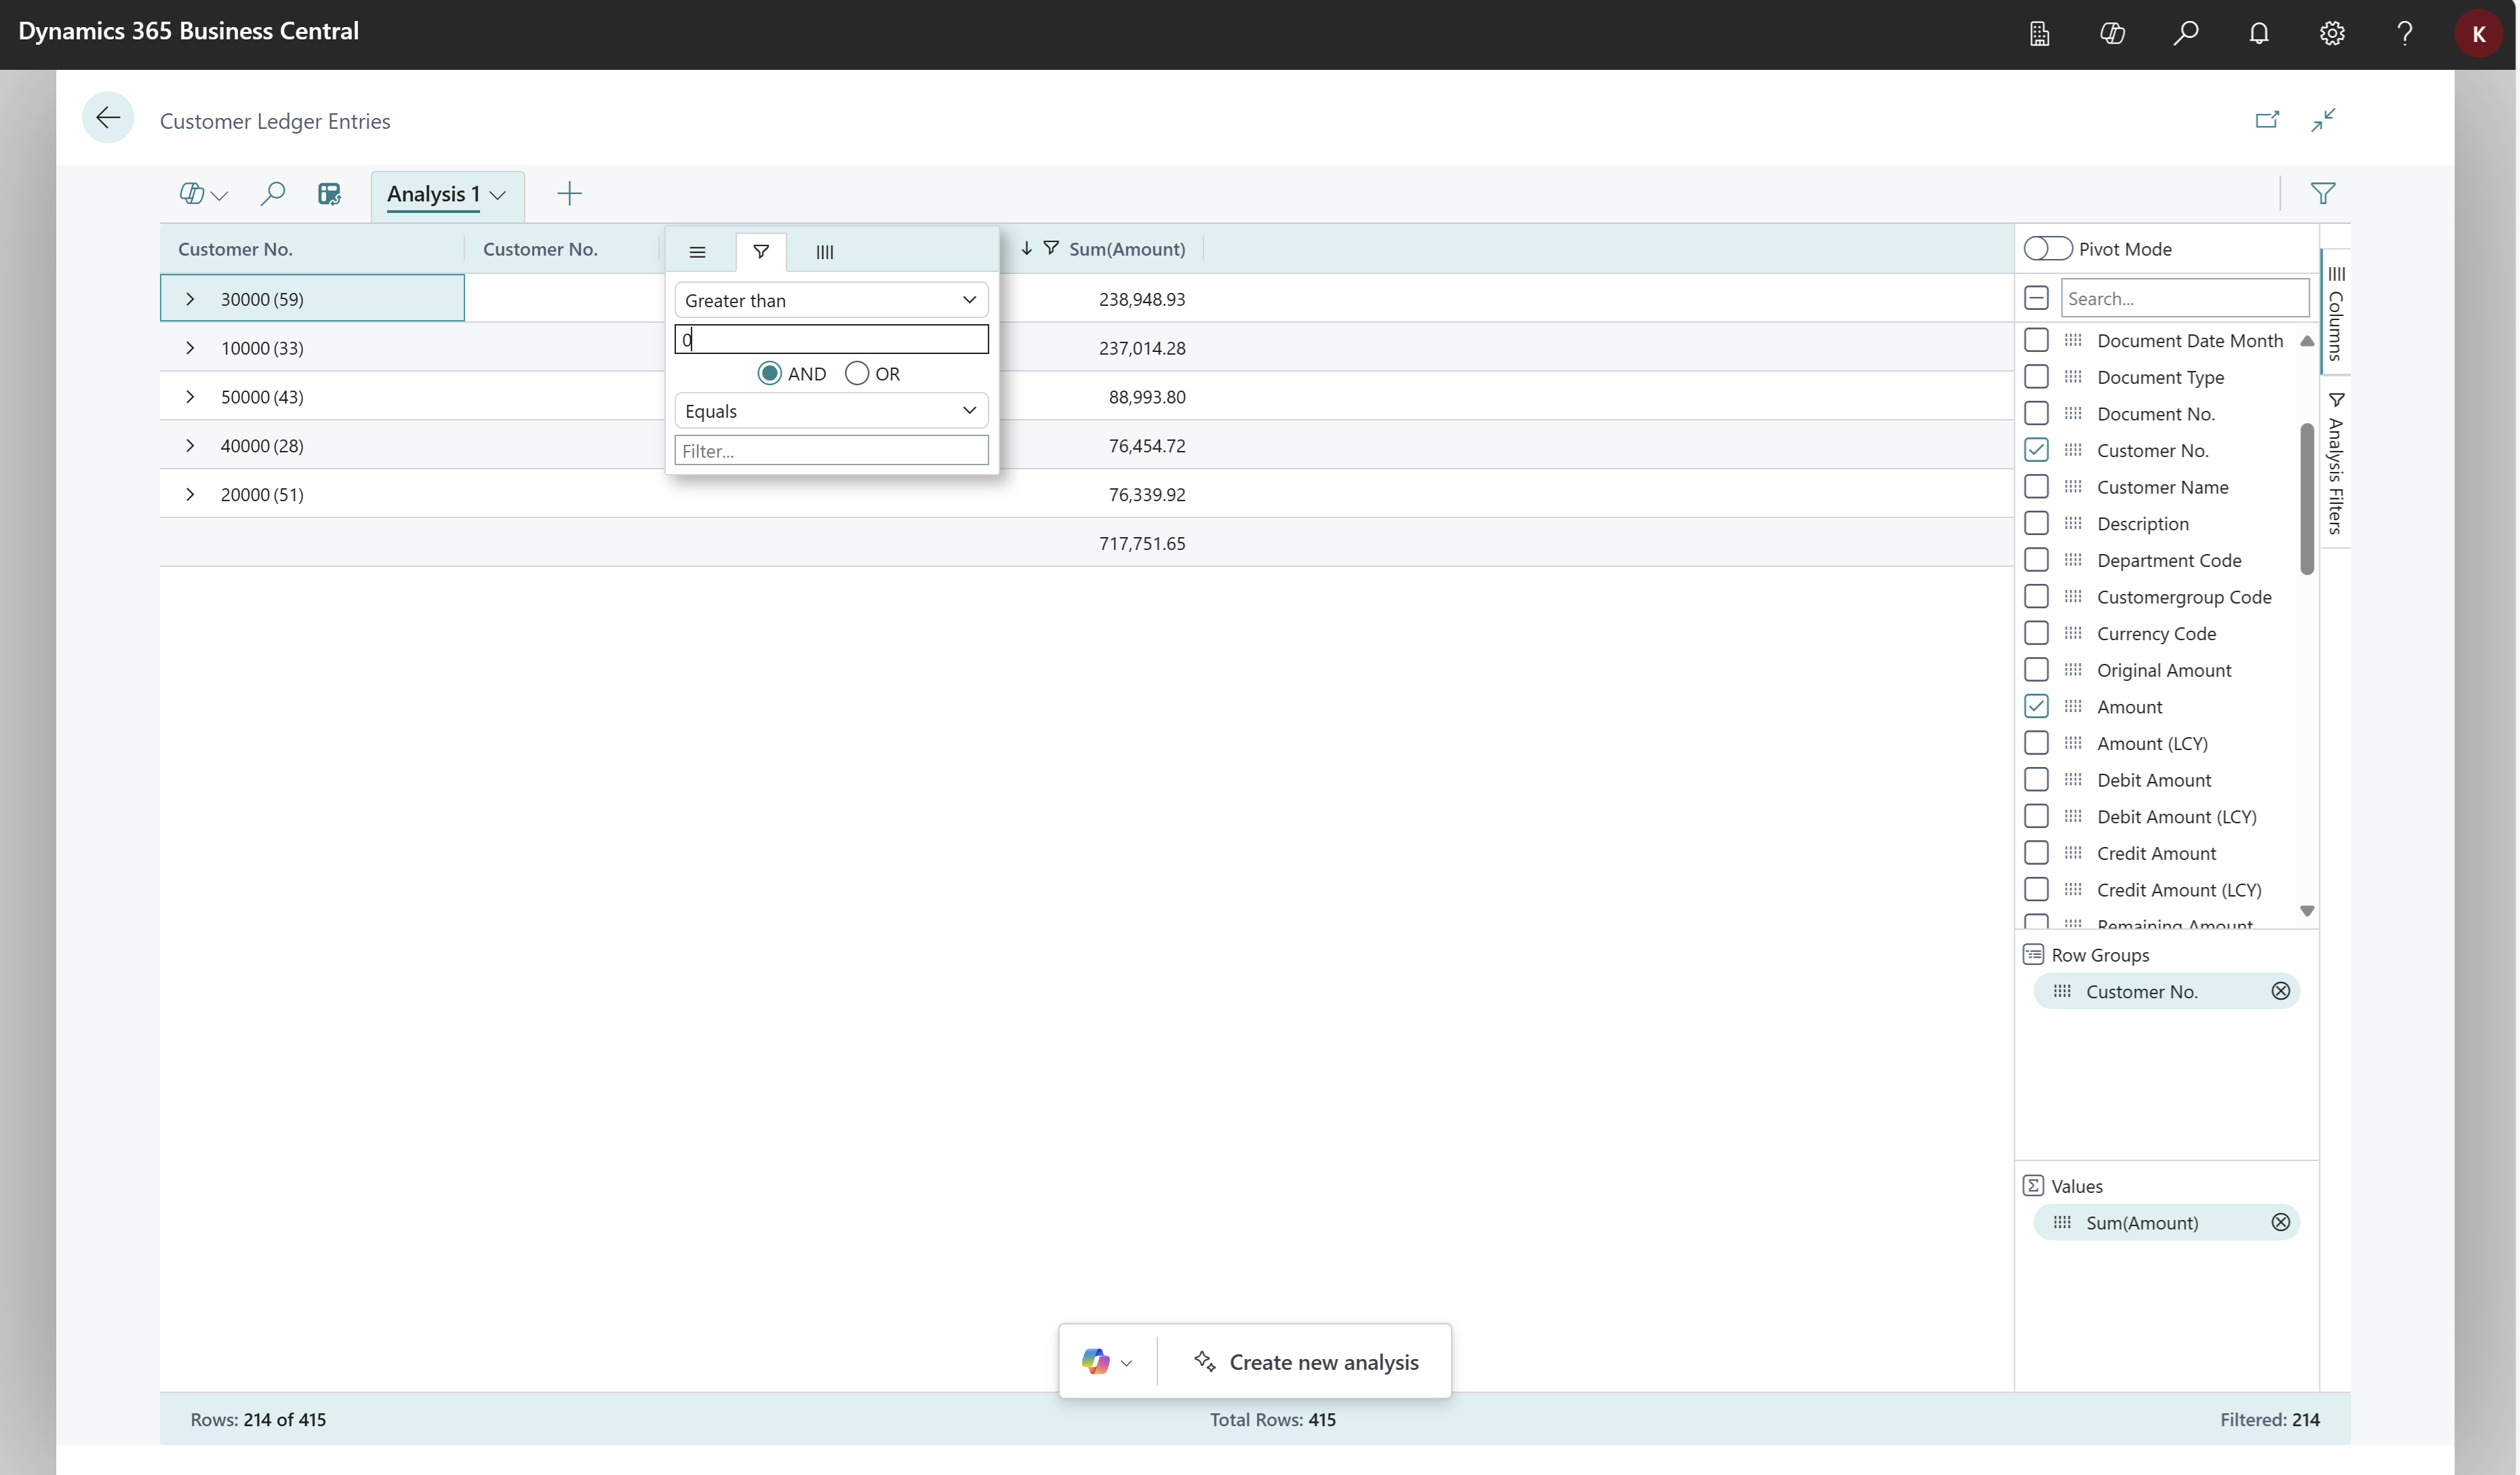
Ad-hoc analytics for management: use analysis mode
For managers, analysis mode in Business Central a game changer. This feature turns every data list (such as customer posts) into a pivot table — without exporting.
Typical applications:
- Customer analyses by due date
- Filter by residual amounts ≠ 0
- Sort data by document date or customer name
Using Copilot Analysis
Via Copilot just enter what you need:
“Show me customer X's outstanding items with document date and expiration date, listed from oldest to newest.”
And voilà — your pivot table appears in seconds.
Preview feature: add fields from other tables
New since version 26.2: you can delete columns related tables add in analysis mode. Useful if, for example, you want to see a customer's email address in your customer mailing list.
Example:
- Add
E-mailto get out of theCustomer-table - Combine customer data with outstanding items
- Create actionable reports in one screen
Make sure to activate this feature in “Feature Management”. If you don't see the option, ask your IT person for help.
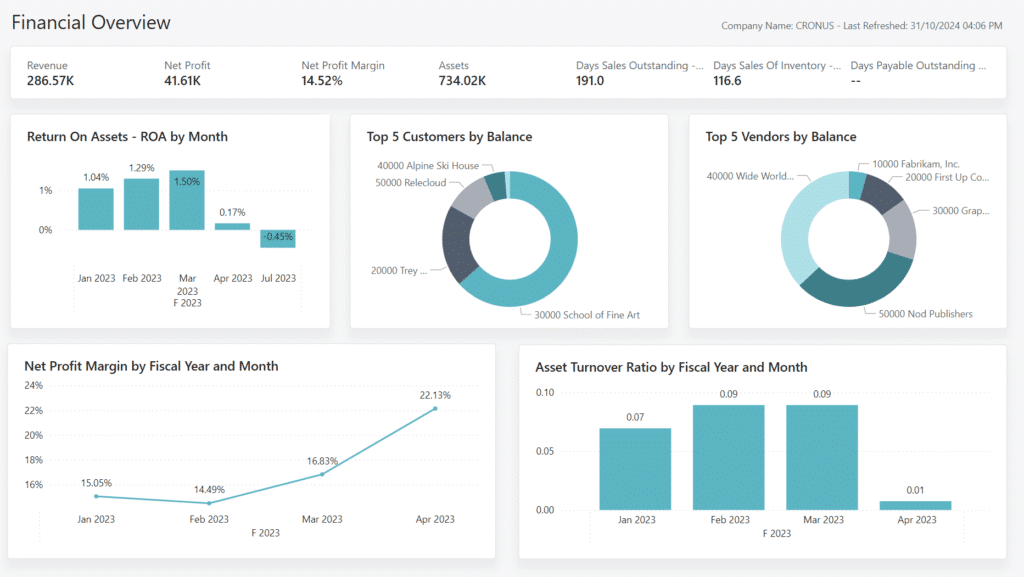
Power BI dashboards for leadership and strategic insight
Power BI dashboards in Business Central provide management and leadership with real-time insight into KPIs. The dashboards are ready-to-use and adaptable.
Available dashboards:
- Sales overview dashboard
- Inventory dashboard
- Finance insights dashboard
- Sustainability reporting
What can you do with it?
- Visualize trends in sales, inventory and billing
- Click through to specific orders or customers
- Base decisions on real-time data
With Power BI, you have the right info in just a few clicks — fully integrated into your Business Central environment. So you don't have to open any additional tools.
Benefits of reporting in Business Central
✔ Direct integration with your company data
✔ Easy to use for any type of user
✔ Support for Word, Excel, PDF and Power BI
✔ Suitable for real-time analysis and reporting
✔ Copilot and AI options for faster insights
Checklist: are you well equipped to report?
✅ Do you know what standard reports your role has?
✅ Are you already using analysis mode in Business Central?
✅ Are Copilot and preview features active?
✅ Are Power BI dashboards connected?
✅ Can your team get insights independently?
Is the answer to any of these questions “no”? Then there is a profit to be made!
Learn how reporting can help you make a profit, plan today a demo!